We're hiring! Join our team as a Senior Test Engineer. Apply here.

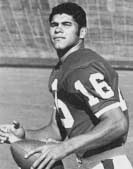
Jim Plunkett
School: Stanford
Position: QB
Heisman Voting: 8th in 1969, 1st in 1970
Draft: 1st round, 1st overall of the 1971 NFL draft by the New England Patriots

School: Stanford
Position: QB
Heisman Voting: 8th in 1969, 1st in 1970
Draft: 1st round, 1st overall of the 1971 NFL draft by the New England Patriots
Player News